
4.0 SOCIO - ECONOMIC FEATURES
4.1 POPULATION CHARACTERISTICS
4 1.1 Maine and the New ngland Region
4 1.2 Merrymeeting Bay and the Surrounding Region
4 1.3 The Surrounding Counties
4.1.4 The Surrounding Towns
4.1.5 Population Projections
4 1.6 Planning Implications
4.2 INCOME CHARACTERISTICS
4.3 EMPLOYMENT AND LABOR FORCE
4.4 ECONOMIC ACTIVITY
4.4.1 Overview
4.4.2 Resource-Based Industries
4:4:3 Manufacturing
4.4.4 Contract Construction Industries
4.4.5 Service Industries
4.4.6 Brunswick Naval Air Station
4 4.7 Wholesale and Retail Sales
4.4.8 Summary of Planning Implications
4.5 TAXATION
4.5.1 The Rise of Property Taxes: 1960-1973
4.5.2 Impacts of Property Taxation on the Elderly and Low Income
Landowners
4.5.3 Property Tax Pressures and the Loss of Farms
4.5.4 Tax Pressures as Incentives to Attract Business
4.5.5 Tax Pressures and Forest Lands
4.5.6 Summary of Planning Implications
4.6 REFERENCES
Population growth trends in New England and Maine have taken a
significant change of direction since the last census in 1970 (see
Table Between 1960 and 1970, New England's population had grown from
10,510,106 to 11,847,186, a 12.7% increase. The nation as a whole
increased by 13.3%. Maine, the slowest growing state in New England,
increased by merely 2.5%. Almost as many people left the state as
were born in it. The natural increase (births minus deaths) numbered
approximately 94,000 between 1960 and 1970; while the net migration
tin-migration minus out-migration) totaled nearly-70,000. That is,
migration resulted in a net loss of population to the state (Dearborn
and Daigle 1972).
Recent figures (Ploch 1974) show that within New England a population
shift may be occurring from Connecticut, Rhode Island, and
Massachusetts to Maine, New Hampshire, and Vermont. Growth rates in
southern New England for the period 1970 to 1974 range from 1.7 to
2.2 percent; whereas in the northern states, growth is increasing at
rates from 5.5 percent in Maine and 9.5 percent in New Hampshire.
In-migration from other states outside of the New England area to
northern New England is also likely, especially in light of the fact
that these states (Maine, New Hampshire, and Vermont) were the only
ones north of the Mason-Dixon line and east of the Rockies to exceed
the U.S. average growth rate for that period (Ploch 1974).
The Merrymeeting Bay area, as defined by this study, encompasses
eight towns (Bath, Bowdoin, Bowdoinham, Brunswick, Dresden, Richmond,
Topsham, and Woolwich) and parts of three counties (Sagadahoc,
Lincoln, and Cumberland). This section will detail population trends
within the three counties and the surrounding towns respectively.
		1960		1970		Change		1974 * 		% Change *
		Population	Population	1960-70		Population 	1970-74
MAINE		969,265		993,663		2.5		1,047,000	5.5
Cumberland Co.	182,751		192,528		5.4 .		199,800		3.7
Lincoln Co.	18,497		20,537		11.0		22,200		8.2
Sagadahoc Co.	22,793		23,452		2.9		26,500		9.4
NEW ENGLAND	10,510,106	11,847,186	12.7 		12,536,128	2.7
UNITED STATES	179,323,175	203,184,772	13.3		--		--

* Estimated
SOURCES: Dearborn and Daigle 1972; Dearborn 1974; Ploch 1974.
Growth As with the state as a whole, population trends in Sagadahoc
and Cumberland counties have recently taken an upward turn. Between
1960 and 1970, these two counties experienced a net out-migration,
despite their high growth rate relative to the rest of the state.
From 1970 to 1974, this trend reversed itself and a net in-migration
resulted (see Table 4-1 and 4-2). The result was higher growth rates
and the most striking change occurred in Sagadahoc County, where the
growth rate jumped from 2.9% during 1960 to 9.4% in just the first
four years of the 1970s. Similarly, Cumberland County is well ahead
of its previous growth rate (5.4 from 1960-1970) with a 3.7% increase
since 1970 (Dearborn 1974),
Lincoln County has been one of Maine's fastest growing counties since
1960. Between 1960 and 1970, it experienced a net in-migration of
1,323 persons, and grew a total of 11 percent (while Maine as a whole
grew only 2.5 percent). Between 1970 and 1974, it continued to grow
at an even faster rate, 8.2 percent in just four years (Dearborn
1974). Relative to other counties in Maine, Lincoln and Sagadahoc
counties still currently rank among the fastest growing. In 1970
Sagadahoc County ranked ninth in the state in terms of growth rates;
Lincoln County, third; and Cumberland County, seventh. By 1974
Sagadahoc County rose to fourth fastest growing while Lincoln dropped
to sixth and Cumberland twelfth .
Population Distribution
In 1970 the population in both Cumberland and Sagadahoc counties was
predominantly urban (62.7 and 62,8 percent respectively) while
Lincoln County in contrast was 100 percent rural. A comparison with
1960 figures shows that Cumberland County lost in urban percentage in
the ten year period while Sagadahoc County gained, and Lincoln
remained the same (Dearborn and Daigle 1972). Figures showing the
population distribution since 1970 are not available. However, some
perceive a reversal of the national trend towards urban concentration
evidenced in the 1960s. Rural areas in Maine seem to be attracting
more households in the early 1970s than urban areas.
Components of Population
Change Since 1970

1970-1973*
		1970		Natural		Net		1973*
		Population	Increase :	Migration :	Population

MAINE 		93,663 		25,842 		19,495 		1,039,000
Cumberland Co.	92,528 		3,800		900		97,200
Lincoln Co.	20,537		100 		1,000 		21,600
Sagadahoc Co.	23,452		700		800		24,900

* Estimated

SOURCE: Dearborn 1974.
Peak Seasonal Population
The state of Maine is known to experience a substantial
populationincrease in the summer season. In 1970 it has: been
estimated thatthe peak seasonal increase added one-half million
people to the state,a 50% increase over the permanent year round
population (Veazie 1972).
Within the Merrymeeting Bay area, in 1970, Cumberland County
increased by an estimated 45%, Lincoln County by 133%, and Sagadahoc
County by 31% (Veazie 1972). See Table 4-3. Relatively little of this
increase concentrated in the towns immediately surrounding the Bay.
The majority of it occurs on the coast and in the coastal towns.
Their total population increased an estimated 15% (see also
discussion below under The Surrounding Towns).
Population Growth
Between 1960 and 1970, the population of the towns surrounding
Merry-meeting Bay grew collectively by 3%. Two towns, Bath and
Richmond, experienced a decline in population (by-10% and-17%
respectively), while all other towns exceeded the state average
growth rate in that decade. Four towns, Topsham, Bowdoin, Woolwich,
and Bowdoinham, grew faster than the national growth rate of 13.3%.
These towns increased by 32%, 28&, 21% and 15% respectively (see
Table 4-4 ).
Since 1970, there is evidence from the increased number of housing
starts (see Chapter 6.0, Section 6.4) that the towns around the Bay
are experiencing a significant increase in population. The town of
Richmond, for example, issued two building permits in 1970; in 1973
the number jumped to 26. Another indication of increased population
pressures in the area is the trend in real estate values which have
risen sharply since 1970 (see Chapter 6,0, Section 6.4).
Peak Seasonal Population
In 1970, the towns around Merrymeeting Bay experienced an estimated
15% increase in population during the peak season (summer). The town
with the largest individual percentage increase was Brunswick (24%)
followed by Richmond (17%), Bowdoinham (13%), Woolwich (12%), Dresden
(s%), Bath (7%), Bowdoin (4%), and Topsham (3%) (Veazie 1972). These
increases are small in comparison to those experienced by the
surrounding counties (see Table 4-3).
TABLE 4-3
PEAK SEASONAL POPULATION ESTIMATES
1970
			Year Round	Seasonal	Peak 		Seasonal
			Population	Increment :	Increase :	Population
MAINE			993,663 	506,725		51		1,500,388
Cumberland Co.		192,528		87,093		45		279,621
Lincoln Co.		20,537		27,293		133		47,830
Sagadahoc Co.		23,452		7,380		31		30,832
MERRYMEETING BAY	37,710		5,522		15 		43,235
Bath			9,679		650		7		10,329
Bowdoin			858		38		4		896
Bowdoinham		1,294		166		13		1,460
Brunswick		16,195		3,866		24		20,061
Dresden			787		74		9		861
Richmond		2,168		362		17		2,530
Topsham			5,022		158		3		5,180
Woolwich		1,710		208		12		1,918

1. Seasonal Increment: year round.
SOURCE: Veazie 1972.
Migration Characteristics
Tables 4-5 and 4-6 show the residence changes in the Bay area for the
periods 1955-1960 and 1965-1970. Between 1955 and 1960, some 19.6
percent of the 1960 resident population had moved into the area from
out of state, or about 6,400 persons. Twenty-nine percent had moved
into the area from elsewhere in Maine, and the remaining 51.4 percent
were residents of the area prior to 1955. Brunswick showed the
greatest out of state influx for that period, some 33.8 percent or
nearly 4,750 persons. This can probably be attributed to the
Brunswick Naval Air Station and Bowdoin College. Elsewhere in the
area, Woolwich, Bath, and Dresden showed influxes of 8.8 percent, 7.7
percent, and 7.3 percent respectively.
By 1970, the percentage of the residents which had moved into the
area from out of state during the prior S-year period had risen to
20.9 percent. This represents some 7,200 persons as compared to the
1955-1960 influx of 6,400 persons. While the overall change is not
significant, the distribution of the influx is. Bath, Bowdoinham,
Bowdoin, and Topsham showed significant influxes as compared to the
1955-1960 period. Dresden and Richmond also saw an increase, but not
as significant, while Woolwich and Brunswick showed a decreasing
out-of-state influx. Map 9 depicts these
changes.
With the recent increases in total population (1970-1974, see Table
4-1), it is expected that the towns surrounding the Bay, especially
Richmond, Bowdoinham, Bowdoin, and Topsham, will continue to grow at
a faster rate and will continue to absorb more out-of-state influx
than it has in the past.
RESIDENCE CHANGES 1955-1960 (1)
(persons 5 years and older)

Present 		Same 	DIFFERENT HOUSE IN MAINE 	OUT OF STATE
Residence 	Total 	House	Same Co.  Diff. Co. % Total	Diff. State  Abroad 	% Total


Bath		9,636	5,349	2,548	  606	    32.7	624	     124	7.7
Bowdoinham	997	682	173	  95	    26.8	43	     --		4.3
Bowdoin		537	372	60	  90	    27.9	10	     --		1.8
Brunswick	14,098	5,373	2,368	  1,192	    25.3	4,319	     457	33.8
Dresden		782	481	90	  154	    31.3	57	     --		7.3
Richmond	1,880	1,090	397	  285	    36.3	77	     27		5.5
Topsham		3,302	1,659	460	  618	    32.6	482	     53		1.6
Woolwich	1,271	837	250	  34	    22.3	112	     --		8.8
TOTAL		32,503	15,843	6,346	  3,074	    29.0	5,724	     661	19.6

(1) Shows place of residence 5 years prior to the 1960 census.
SOURCE: U. S. Population Census.
RESIDENCE CHANGES 1965-19701
(persons 5 years and older)

Present 		Same 	DIFFERENT HOUSE IN MAINE 	OUT OF STATE
Residence 	Total 	House	Same Co.  Diff. Co. % Total	Diff. State  Abroad 	% Total

Bath		8,866	4,948	1,762	  750	    28.3	l,013	     175	13.3
Bowdoinham	1,214	789	169	  94	    21.6	162	     --		13.3
Bowdoin		729	486	88	  21	    14.9	115	     12		17.4
Brunswick	14,728	5,664	2,459	  1,301	    25.5	4,120	     386	30.6
Dresden		822	542	95	  82	    21.5	98	     --		11.9
Richmond	2,037	1,028	380	  380	    37.3	168	     7		8.5
Topsham		4,531	2,298	727	  528	    27.7	807	     49		18.9
Woolwich	1,453	967	336	  36	    25.6	73	     --		5.0
TOTAL		34,380	16,722	6,016	  3,192	    26.8	6,556	     629	20.9

1. Shows place of residence 5 years prior to the 1970 census.

SOURCE: U. S. Population Census.
Generally, population projections made prior to 1970 for the
decade between 1970 and 1980 have fallen short of the trends
evidenced by the recent figures for 1974 (Dearborn 1974). The Maine
State Planning Office projected that between 1970 and 1980 Sagadahoc
County would grow by 24.2%, Lincoln County by 10.7%, and Cumberland
County by 7.2% (State Planning Office 1973). We have seen previously
that Sagadahoc County has grown by 9.4 in the first four years of the
decade alone, that Lincoln County had grown by 8.2% by the end of
1974, and that Cumberland County had grown by 3.7% in this
period.
Obviously there are forces at work which have resulted in an
unexpected acceleration of population growth in Maine and the
Merrymeeting Bay area since 1970. With the completion of I-95 along
the western edge of the Bay, we believe this growth trend will be
even more dramatically increased in the towns surrounding the
Bay.
The preceding examination of population characteristics and trends
in the Merrymeeting Bay area points to the following:
1. The population of the area is growing at an unexpected and
accelerating pace due to a large influx of out of staters. It is
suspected that many seek a rural atmosphere such as that found in the
towns surrounding the Bay. Advanced planning will be needed if the
Bay towns are to retain their rural undeveloped character while
absorbing the new growth. Chapter 6 details the planning implications
of growth in terms of development trends.
2. Seasonal population increases in the Bay towns are insignificant
compared to seasonal increases which occur in the adjacent coastal
towns. The Bay is not seen as an attraction to tourists at
present.
missing text #100 - 105
PLACES OF WORK OF MERRYMEETING BAY RESIDENTS
1970

		Total	Andros.	Cumberland Co.	   Sagadahoc Co.	Lincoln	KennebecKnox	Other &
Residence	Workers	County	Ptld.	Other(l)Bowdoin	Topsham	Other(2)County	County	Co.	Not Rep.
Bath		3,542	21	30	462		21	2,703	109	22		174
Bowdoin		291	57		84	89	33	28
Bawdoinham	467		16	115		7	254		46		29
Brunswick	6,618	102	186	4,311	na	na	839	67	46		1,067
Dresden		339				na	na	121	112	88		18
Richmond	804	47	7	5			446	22	172		105
Topsham		2,043	54	49	890		456	354	34	9		197
Woolwich	570		6	93		12	403	20		9	27

TOTAL		14,674	281	294	5,960	89	529	5,148	364	383	9	1,617

1. Primarily Brunswick
2. Primarily Bath

SOURCE: U. S. Census of Population.
The period from 1960 to 1973 saw a dramatic shift in the growth
rate of major economic sectors in Maine. Manufacturing, for example,
while remaining the dominant sector in terms of number of jobs
generated in 1973 (employing some 109,650 out of 398,600 persons),
nevertheless recorded a negative growth rate (-3.5%). The fastest
growing sectors emerged as service industries (+78.7%); government
(+65.3%); finance, insurance, and real estate (+48.8%); and trade
(+37.3%). Transportation and public utilities sectors declined by
2.1%, manufacturing by 3.5%, and agriculture by an undetermined
amount (see Table 4-12).
In the Merrymeeting Bay region (Sagadahoc, Lincoln, and Cumberland
counties), a predominance of jobs were held in the wholesale/retail
trade sector, service sector, and manufacturing sector in 1970, with
a trend towards the increase of the public administration,
govern-mental sector, construction sector, service and trade sectors.
While manufacturing declined in general in this tri-county region, it
showed an increase in Sagadahoc County (see Table 4-13).
In the towns immediately surrounding Merrymeeting Bay, of a total of
13,558 jobs in 1970, 4,P42 were held in the manufacturing sector,
3,373 in the service sector, 2,136 in wholesale and retail trade
sector, 847 in public administration and government, 882 in
construction industries, 525 in the transportation, utilities sector,
and 299 in primary resource industries (forestry, agriculture,
fishing, and mining; see Table 4-13). The 1960-1970 trends showed the
greatest relative increase in construction industries (+66.4%
followed by public administration and government, 48.3%),
utilities/transportation (+34.5%), service industries (+32.6%), and
trade (+20.4%). Manufacturing had slowed to a 2.1 % increase over
1960, and resource industries had declined 13,5% from 1960 (in number
of jobs , see Table 4-13 and 4-14). The more significant economic
sectors, both past (resource-based industries and manufacturing) and
present (wholesale and retail trade, services, construction, and
government) will be discussed in detail in the following
paragraphs.
JOBS BY INDUSTRY
Maine Trends 1960--1973
							% Change Change % Change
			1960 	1970 	1971 	1973 	1960-1970	1960-1973	1970-1973
Agriculture		21,900	14,400	13,000	n.a.	-34.2		n.a.		n.a.
Manufacturingl		113,670	117,750	108,920	109,650	+ 3.5		-3.5		-6.8
Leather			24,100	25,810	22I690	20,150	+ 7.0		-16.4		-21.9
Paper, Allied Prod.	18,150	17,730	16,830	17,780	-2.3		-20.4		0.2
Lumber, ood Prod.	16,900	14,200	13,480	13,640	-16.9		-19.3		-3.9
Food, Food Prod.	11,400	11,490	11,650	10,630	+ 0,7		-6.8		-7.4
Textiles		14,100	10,900	8,860	9,360	-22.6		-33.6		-14.1
Shiplbuilding, Transp.	14,360	12,330	10,660	10,100			-29.7		-18.0
Trade			53,900	65,920	67,690	74,010	+22.3		+37.3		+12.2
Wholesale		14,550	14,330	14,400	15,520			+6.7		+8.3
Retail			39,350	51,590	53,290	58,490	+31.1		+48.6		+13.3
Government		39,030	59,040	62,540	64,520	+51.2		+65.3		+9.2
Finance, Insur., and
Real estate		9,000	12,210	12,660	13,390	+35.6		+48.8		+9.6
Real Estate		1,410	1,780	1,760	1,670	-26.2		+18.4		-6.1
Transportation, Publ.
Utilities		18,100	17,540	17,460	17,720	-3.0		-2.1		-1.0
Contract Construction	13,600	16,820	17,000	19,440	+23.6		+42.9		+15.5
Service			30,200	42,930	45,990	53,960	+42.1		+78.7		+25.6

SOURCE: Maine Department of Commerce and Industry 1974.
JOBS BY INDUSTRY 1970
Merrymeeting Bay Region
							Fin.
		ResourceContract	Util/		Insur.		Publ.Adm/
		Indus.	Const.	Mfg.	Trans.	Trade	R.Est.	Service	Govt.	TOTAL(1)
MAINE		--	16,820	117,750	17,540	65,920	12,210	421930	59,040	--
Sagadahoc Co.	364	305	31946	220	864	119	1,976	1,568	9,362
Lincoln Co.	727	1,281	713	198	1,203	145	1,656	957	6,88Q
Cumberland Co.	1,400+	4,868	191408	6,057	22,952	6,319	22,384	11,679	95,067
MERRYMEETING BAY299	882	4,442	525	2,136	--	3,373	847	13,558
Bath		43	183	1,333	220	576	--	772	244	3,644
Bowdoin		30	42	99	5	15	--	67	17	279
Bowdoinham	19	24	163	16	64	--	100	35	453
Brunswick	80	349	1,394	154	1,013	--	1,699	349	5,541
Dresden		45	33	105	21	37	--	60	21	35?
Richmond	26	62	381	40	48	--	175	67	851
Topsham		40	154	717	28	286	--	371	82	1,824
Woolwich	16	35	250	41	97	--	129	32	609

1. TOTAL for the towns includes other miscellaneous industries in addition to those listed.
SOURCES: U. S. Census of Population
Curtis Harris, University of Maryland in TRIGOM 1974.
Maine Department of Commerce and Industry 1974.
In the Merrymeeting Bay region, broadly including Sagadahoc, Lincoln,
and Cumberland counties and more narrowly defined as the towns
adjacent to the Bay, resource-based industries include agriculture,
mineral extraction, and forestry. (This category of industries does
not include the manufacture of products from resources such as paper
from wood). The importance of these industries in generating job
opportunities and in contributing valuable products to the rest of
the state (or nation) is discussed below.
In general, resource-based industries have historically been
declining in activity relative to other industries in Maine. Since
1940, the number of jobs in the state in agriculture, forestry, and
fisheries has declined from 40,700 to less than 15,000 in 1970
(American Forestry Institute 1972). In the last decade alone, Maine
as a whole experi-enced a 34.2% drop in the number of jobs in the
agricultural sector, and a 16.9% drop in jobs in the lumber and wood
products (excluding paper) industries (see Table 4-14).
In the Merrymeeting Bay region, since 1960, Sagadahoc County as a
whole has experienced no change in the number of resource-based jobs;
Lincoln County has experienced an increase of 8.9%; and Cumberland
County a decrease of 19%. Within the Bay Study Area, the towns of
Bowdoinham, Brunswick, Richmond, and Woolwich have experienced a net
loss in the number of resource-based jobs while Bath, Bowdoin,
Dresden, and Topsham have had an increase. Overall, these towns have
lost 13.5 percent of the total resource-based jobs since 1960 (see
Table 4-14). There is little information on resource-based industry
avail-able at the town level. However, the report of the Dresden
Planning Board (1971) described the decline of these in that town and
is probably indicative of the trends being experienced by all small
towns around Merrymeeting Bay:
For a great many years the townspeople of Dresden were their own
bosses. They farmed the land, raised most of what they needed for
food, clothing and other necessities of life and they were happy...As
the surrounding areas, have over the past two
JOBS BY INDUSTRY
Percent Change 1960-1970
							Fin.
		ResourceContract	Util/		Insur.		Publ.Adm./
		Indus.	Constr.	Mfg.	Trans.	Trade	R.Est.	Service	Govt.	TOTAL
MAINE			+ 23.6	+ 3.5	- 3.0	+ 22.3	+35.6	+ 42.1	+ 51.2
Sagadahoc Co	  0.0	- 4.5	+18.8	-16.0	-17.4		+30.5	+335.5	+16.3
Lincoln Co.	+ 8.9	+137.2	-54.8	-37.3	+ 22.0		+ 42.6	+208.7	+10.4
Cumberland Co.	-19,0	+ 22.4	+29.3	+ 2.2	+ 53.1	+86.6	+ 59.1	+ 61.0	+44.7
MERRYMEETING BAY	-13.5	+ 66.4	+ 2.1	+ 34.6	+ 20.4	+ 32.6	+ 48.3	+15.9
Bath		+65.3	+ 45.2	-22.5	+ 61.7	+ 0.6		+ 6.6	+ 79.4	-7.4
Bowdoin		+87.5	+250.0	+17.8		+ 36.3		+219.0	+ 41.6	+78.8
Bowdoinham	-64.1	+200.0	+13.9	+100,0	+220.0		+ 25.0	+191.6	+35.1
Brunswick	-29.2	+ 63.8	+12.6	6.6	+ 26.4		+ 41.3	+ 40.7	+24,8
Dresden		+2S.5	+ 94.1			+ 23.3		+ 56.5	-38.2	+18.2
Richmond	-36.5	+ 40.9	+12.0	+ 60.0	-29.4		+ 9.2	+ 26.4	+ 8.2
Topsham		+25.0	+ 87.8	+32.7	-30.0	+ 47.4		+ 42.6	+ 36.6	+45.6
Woolwich	-46,6	+ 25.0	+52.4	+156.2	+ 25.9		+180.4	+ 60.0	+28.7

SOURCES: Table 4-13
U. S. Census of Population 1960
centuries, grown requiring the various services of laborer, clerical
worker or professional, the makeup of the Town of Dresden has changed
from one of farmers and fishermen to nearly a completely residential
area-the bedroom for such areas and activities as the Bath Iron
Works, Brunswick Naval Air Station, Central Maine Power, U. S.
Veterans Administration at Togus, the State of Maine, factories and
mills in Augusta, Gardiner, Richmond, and Wiscasset.
The following paragraphs will discuss in detail the various types of
resource-based industries and their role in the economy of the area,
past, present, and future.
Agriculture
The land surrounding Merrymeeting Bay is low and gently rolling, and
gradually becomes hummocky as higher elevations are reached upland.
Near the Bay, floodplain soils and glacial till deposits form some of
the most productive agricultural soils in the state. Because of the
low flat character of this area, areas of Class I and Class II
agricultural soils from 50 to 100 acres in size can be found along
the Bay on Green Point, Abagadasset point, and Pleasant Point. As one
proceeds upland the hilly character of the land reduces the size of
the Class I and II areas, making such areas less prime for large
farming operations.
Overall, farm activity in the Merrymeeting Bay region (Sagadahoc,
Lincoln, and Cumberland countries) has been steadily declining. The
number of farms in Sagadahoc County (which includes most of the Bay
towns) dropped from 253 to 113 during the five-year period from 1964
to 1969; and it is estimated that the number has since fallen to 94
(see Tables 4-15 and 4-16). The total acres in farmland dropped from
37,000 to 1B,542 between 1964 and 1969 while the average size per
farm increased slightly from 146.6 to 155.2 acres. During this time,
farm values (per acre) in Sagadahoc County rose 29 percent. Similar
trends are evidenced in Lincoln and Cumberland counties; except that
in Cumberland County, the average size of farms declined. This
probably resulted from the fact that the number of 1000+ acre farms
dropped from 9 to 6, while in Sagadahoc and Lincoln counties, the
number of farms in this size class either increased or remained the
same.
FARM INDICATORS-MERRYMEETING BAY
1974 Estimates
			Sagadahoc Co.	Lincoln	Co.	Cumberland Co.
			1969	1974	1969	1974	1969	1974
Number of farms		113	94	195	163	536	448
Average size (ac.)	155.2 1	.58.3	166.3	169.6	125.8	128.3
Average Value of
Land/Buildings per acre	190	324	222	379	282	482

SOURCE: Maine Department of Agriculture, unpublished estimates 1975.
Estimates on farm size and value for the period since 1969 are also
found in Table 4-16. These estimates were derived by taking 1974
state figures and applying the trends evidenced by these to the
individual counties. Since the number of farms statewide has dropped
16.5% between 1969 and 1974, the number of farms in each of the
counties in the Merrymeeting Bay area is assumed to have declined by
this percentage also (Maine Department of Agriculture, unpublished
data 1975).
There is little information on farm activity available at the town
level. However, the Dresden Planning Board report of 1971 indicates a
serious decline which is probably typical of all towns around the
Bay. By the Spring of 1969, only one dairy farm remained within the
town, although a few herds of beef, replacement or breeding stock
were to be seen...The town, once principally characterized by open
fields and pasture land, has returned to its eighteenth century
woodlands.
The decline in agricultural activity can probably be attributed to a
number of factors including rising real estate values, declining farm
products prices, increasing costs of farm supplies (such as feed,
fertilizer, machinery, baling twine, etc.),poor market development
and an increase in the number of work options available. Perhaps one
of the most serious problems is the growing disparity between farm
income and expenditures. In Sagadahoc County in 1969, eighteen out of
twenty-two farms with sales greater than $40,000 had expenses greater
than $40,000 and in general, most farms had expenditures equal to or
greater than half the total sales (see Table 4-1'7).
The farms most seriously affected are those represented by sales less
than $20,000. Between 1964 and 1969, forty out: of sixty-four farms
in this sales class dropped out of production (or to below sales of
$2,500 per year) in Sagadahoc County; fifty-nine out of 110 were
eliminated in Lincoln County, and 100 out of 245 were lost in
Cumberland County (see Table 4-18).Those with sales of $20,000 or
more remained stable. In the recent past, livestock growers and dairy
farmers have been particularly hard hit by rising feed costs. This
problem stems in part from national sales of grains to foreign
countries coupled with the increased costs of transportation from the
Midwest which have reduced supplies and increased costs.
The high cost of product to consumers caused by high mark-up by
distributors has contributed to another trend in the area: the
increase of small scale organic gardening. As local-based cooperative
food markets continue to develop, these small scale producers will
find better markets and may help slow the trend of declining farm
activity.
FARM SALES AND EXPENDITURES 1969
		Sagadahoc Co.	Lincoln Co.	Cumberland Co.
SALES $
40,000+		22		23		81
20,000-39,999	13		26		67
10,000-19,999	7		18		50
5,000-9,999	3		15		42
2,500' 4,999	14		18		53
EXPENDITURES $
40,000+		18		24		71
20,000-39,999	16		17		47
10,000-19,999	6		18		63
5,000-3,999	12		21		52
2,000-4,999	5		13		40

SOURCE: U. S. Census of Agriculture 1969
(Maine Department of Agriculture)
FARM INCOME AND SALES
Merrymeeting Bay Region 1964-1969
			Sagadahoc Co			Lincoln Co			Cumberland Co
			1964		1969		1964		1969		1964		1969
No. farms by sales of
$40,000+		26		22		26		23		77		81
$20,000'39,999		10		13		36		26		87		67
$10,000-19,999		22		7		32		18		95		50
$ 5,000' 9,999		22		3		36		15		73		42
$ 2,500' 4,999		20		14		42		18		77		53
Market Value-all prod.	2,760,650	2,417,661	4,059,750	5,111,295	ll,163,500	11,827,223
Av.per farm ($)		10,912		21,395		9,759		26,211		12,700		22,065
Crops ($)		276,699		238,547		314,769		254,063		2,377,677	2,080,669
Forest Products ($)	35,930		6,121		93,384		31,450		170,815		53,596
Livestock, Poultry
& Products ($)		2,446,465	2,172,993	3,628,016	4,825,782	8,585,383	9,692,958

SOURCE: 1969 Census of Agriculture--County Data, Maine Depautment of Agriculture
Other problems affecting the farming sector in addition to increasing
costs of production, declining farm product prices, and poor markets
include increasing land values and difficulty in obtaining financing.
The state Farm and Open Space Land Law reduces the tax pressure on
farmlands which might result as land values increase due to
development pressures (see Section 4.5). However, the declining
profitability of farming, the difficulty of obtaining financing to
overcome short term losses, and the increasing profitability of real
estate sales are combining to increase the number of farmers who are
opting to drop out of production and sell part or all of their land
for residential or commercial uses. The result is a loss in the
agricultural resource capabilities of the area, and of the state as a
whole. This loss will be, unfortunately, irreversible if farmland is
committed to residential or commercial development. In the past,
farmers who found agricultural production uneconomical often
abandoned their fields which then eventually reverted back to
woodland. The town of Dresden is a case in point. However, as the
demand for developable land may increase with the completion of I-95,
the option of capitalizing on now desirable open lands could result
in the permanent loss of valuable agricultural land. It should be
noted that while most farmers feel that agricultural productivity
should be maintained and enhanced, many also feel that landowners
should be allowed to do what they wish with their own land.
Finding a solution which will at once conserve the prime agricultural
resources of the area yet avoid penalizing the farming sector, which
now feels more than most sectors the impacts of a depressed economy,
will involve combining regulatory mechanisms such as zoning and
financial incentives such as the formation of Community Development
Corporations-(CDC). A CDC could assist farmers in forming marketing
cooperatives, providing community grain storage areas, providing
credit and financing, the formation of farm cooperatives which could
pool labor and equipment, providing educational services, and
lobbying for farm interests at the state level. Another approach
might be the encouragement of additional state action in easing the
financial roadblocks many farmers now face. Presently there is some
relief available through FHA and a State Production Credit program,
but more is needed. The State Development Office could well be the
vehicle to establish a farm credit program which could assist farmers
in providing low interest loans to offset the temporary setbacks
caused by inflation or recession or to establish cooperatives as
mentioned above.
Still another approach is suggested in a report recently issued by
the Connecticut Governor's Task Force for the Preservation of
Agricultural Land. This report recommended the state preserve enough
farm-land to produce one-third of the foodstuff its people require
(this amounts to 325,000 acres in Connecticut). It further recommends
that the state should buy development rights to those acres' while
leaving the farms in their present ownership; and that the purchase
will require a bond issue of $500 million to be retrieved by a 1% tax
on real estate transfers.
Forestry
Almost 90 percent of the state of Maine is covered by commercially
valuable forests (see Table). In the past ten years, the amount of
forested land has increased by 3% from 17.2 million acres to 17.7
million acres. Despite this trend, in Sagadahoc, Lincoln, and
Cumberland counties, which surround Merrymeeting Bay, commercial
forest lands have declined since 1959 from 889,000 acres to 778,300
acres (see Table 4-19).
Ownership of commercial forests in the state as a whole is dominated
by large forest industries. These industries own approximately 49% of
Maine's commercial forests while public agencies own less than 2%;
farmers 6.5%, and other private owners 43%. In the Merrymeeting Bay
region, the ownership pattern is quite different with a majority
being owned by private interests (88%); 10.6% by farmers; 1.2% by
public agencies; and none by forest industries (see Table 4-20).
Logging activity for most of the Merrymeeting Bay study zone has been
significant. In the last ten years, all but a very few areas have
been commercially cut. In 1971, Sagadahoc, Lincoln, and Cumberland
counties produced 21,422 thousand board feet of saw logs and 97,700
rough cords of pulpwood. It is not known how much of this came from
within the study area. Sagadahoc County, which includes a majority of
the study area, is notably the lowest producer of the three counties,
however (see Table 4-21). Since 1960, it has averaged an annual
production of over 2.5 million board feet of saw logs and 18,000
rough cords of pulpwood (Veazie 1973).
As most of the commercial logging within the area is done by small
commercial operators, paid by a private landowner, cutting operations
occur in an in-and-out manner; often without regard to proper forest
management. Erosion and damage to the future productivity of the
forest system under such conditions are frequently the result. Table
4-22 describing the acres of various stand size classes indicates
that a majority of the area in Lincoln, Sagadahoc, and Cumberland
counties is covered with saplings and seedlings. This class of stand,
which generally reflects overcutting, a lack of planning for future
productivity, abandonment of agricultural fields, and poor markets
will require an accelerated program of forest management to improve
the quality and growth rate (SCS 1974).
Presently there are two service foresters and one district forester
(Bureau of Forestry) employed in the Merrymeeting Bay area whose
primary function is to assist small woodlot owners (500 acres or
less, see also Chapter 7, section 7.3).
AREA OF COMMERCIAL FOREST LAND
1959-1971
(thousand acres)
			1959				1971
			Area		%Total		Area		%Total
Sagadahoc County	141		86		130.3		79
Lincoln County		245		84		217.4		76
Cumberland County	503		89		430.6		77
MAINE			17,169		86		17,748.6	89

SOURCES: Ferguson and Longwood 1960
Ferguson and Kingsley 1972.
OWNERSHIP OF COMMERCIAL FORESTS RESOURCES 1971
(000 acres)
			Public	   Private	Total
				Farmer	Other
Sagadahoc County	2.3	14.8	113.2	130.3
Lincoln County			17.5	199.9	217.4
Cumberland County	6.4	50,2	374.0	430.6
TOTALS			8.7	82,5	687.1	778.3

SOURCE: Ferguson and Kingsley 1972.
TIMBER PRODUCTS OUTPUT
in
MERRYMEETING BAY REGION
1971
			Saw logs	Pulpwood (000 rough cord)
			(000 bd-ft.)	1970		1971
MAINE			83,640		3,220.9
Sagadahoc County	1,867		18.5		15.1
Lincoln County		5,958		48.3		38.6
Cumberland County	13,597		49.4		44.0
Subtotal		21,422				97.7

SOURCES: Ferguson and Kigsley 1972.
Bones and Dickson 1971.
FOREST STAND SIZE CLASSES (acres)
							Saplings-	Non-
			Sawtimber	Poletimber 	Seedlings	Stocked		Total
Lincoln County		35,400		27,700		102,300		3,200		168,600
Sagadahoc County	38,900		291400		42,900		3,600		114,800
Cumberland County	13,500		10,200		23,400		100		47,200
TOTALS			871800		671300		168,600		6,900		330,600
%Total			26.5		20.3		50.9		2.0		100

SOURCE: SCS 1974
missing page 4-38
If proper care is taken in the mining and rehabilitation of sand and
gravel sites, the environmental and aesthetic impacts could be
minimized (see Chapter 8.0).
Manufacturing employs more workers in Maine than any other single
economic sector. This is true of the towns surrounding Merrymeeting
Bay as well. In 1970, 4,442 out of 13,558 jobs in the Bay towns were
in manufacturing industries (see Table 4-13 in Economic Overview).
The majority of these were located in Bath (1,333) and Brunswick
(1,394). Manufacturers located in these and other Bay area towns in
1974 are listed in Table 4-24.
The largest single employer in the Merrymeeting Bay region, the Bath
Iron Works, employs 3,700 people (March 1975 figures from Maine
Sunday Telegram 3/30/75). A spokesman for the company stated that
Bath Iron Works intends to maintain this level, increasing slightly
at least until mid-1976 (Maine Sunday Telegram 3/30/75). The number
presently employed is up 1;500 from the previous year and a half. At
that time (fall 1973) the company had completed a nearly two-year
effort to increase the shipyard's capacity to a more competitive
capacity. This included a doubling of the steel fabricating capacity
(East Brunswick), the installation of the 220-ton capacity crane in
Bath, and a number of production design alterations (Kennebec Journal
2/17/73). Despite Bath Iron Work's rising labor needs and the high
unemployment rate in the area (see Labor Force and Employment
section), the company has found it difficult to obtain enough skilled
workers to meet its needs. A recent attempt to recruit some 100
unemployed pipefitters met with little success. The reason, a
spokesman has conjectured, is that currently unemployed pipefitters
and plumbers are accustomed to a much higher wage scale in the
construction fields ($8.50 per hour) and are similarly accustomed to
winter lay-offs. They are thus unwilling to make a long term
commitment to a job that pays only half their normal pay rate ($4.50
per hour) when they expect activity in the construction fields to
pick up shortly (Maine Sunday Telegram 3/30/75).
1974 CENSUS OF MANUFACTURING
Merrymeeting Bay
				No.
TOWN		FIRM			EMPLOYED1	PRODUCT
BATH		Auerback Shoe Co.	*501-600	women's snow boots
		Bath Canning Co.	51-75		canned sardines, froen shrimp
		Bath Iron Works		*2500-37002	steel vessels
		Bath Printers, Inc.	1-4		printing
		Coastal Publishing Co.	*11-25		newspaper
		Congress Sportswear Co.	76-100		mens, boys clothing
		Dispatchit		1-4		fuel delivery controls
		Dittmore-Freimuth	5-10		refurbishing electronic items
		Downeast Machine and
		Engineering		1-4		machine shop
		Down East Publications	1-4		newspaper
		MacDonald 3D Mag. Signs	5-10		plastic magneic signs
		Oakhurst Dairy Co.	26-50		dairy products, fruit drinks
		Redlon's Inc.		1-4		roof flanges, closet fittings
		Riverview Pattern Works	O		wood patterns, models
BOWDOIN		Clifford Card				lumber
BOWDOINHAM	Corenco Corp.		*26-50		mixed fertilizer
		Merrymeeting Farm	1-4		poultry processing
		Skowhegan Footwear, Inc	26-50		leather footwear
BRUNSWICK	Aeromarine Corp.	5-10		marine hardware
		Arrow-Hart, Inc.	26-50		molded plastic parts
		Auerback Shoe Co.	*501-600	women's snow boots
		Bath Industries, Inc.	*2501-3000	crushed machinery and parts
		Brunswick Publishing Co	51-75		newspaper, printing
		Engravers-Plastifab	O		engraving, die making
		J. H. French & Son	5-10		printing
		Health-Tex, Inc.	301-350		children's clothing
		Jay Corp.		201-250		artists/commercial brushes 																			and equipment
		Keena Corp		5-10		reinforced gum tape
		Marriner Lumber Co.	----		lumber, ship timbers
		G. A. Peterson Co.	*11-25		transit-mixed concrete, asphalt
		Pine Spring Water Co.	1-4		spring water, carbonated beverages
		Scandia Seafood Co.	26-50		processed shrimp
		Sewall and Son, Inc.	26-50		innersoles
		Tondreau's Bakery	5-10		bakery products
		Visi-Tray Mount Co.	--		stamp mounts
		Washburn Lumber Co.	--		lumber
DRESDEN		Rock-N-Stop		O		minerals, cut stones, jewelry
		Wood Products Co.	O		sweeping compound
		Jack Manchester		O		lobster trap stock
RICHMOND	Clarostat Mills		26-50		electronic components
		Charles A. Eaton Co.	301-350		men's dress and work shoes
		John Wallace
		  (Brown's Mill)	1-4		lumber
TOPSHAM		Ronald Atwood		11-25		pre-cast cement products
		Granite Paving Co.	26-50		bituminous concrete, transit-
															mixed concrete
		Harpswell House		5-10		slate and wood desk accessories
		Hearst Corp
		  (Pejepscot Div.)	401-450		newsprint, specialty paper
		Maine Times, Inc.	5-10		newspaper
WOOLWICH	Harvey's Machine Co.	O		machine shop
		Pine Tree Pattern	O		casting patterns

1. Zero indicates business is owner-operated. *Multi-unit Firm, figure covers all units.
2. Recent figures from Bath Iron Works in Maine Sunday Telegram, 3/30/75.

SOURCES: Maine Department of Manpower Affairs 1973a,
Maine Bureau of Forestry 1973.
The result is that the Bath Iron Works must train unskilled workers
to fill the vacant positions. This phenomenon is indicative of the
statewide shift from manufacturing to construction and other higher
paying fields (see Table 4-14).
Other major manufacturing firms which employ large numbers of Bay
area residents include the Auerback Shoe Company in Bath and
Brunswick, Health-Tex, Inc. (textiles) in Brunswick, Charles Eaton
Co. (shoes) in Richmond, and the Hearst Corp. Pejepscot Division, in
Topsham (see Table 4-24).
Table 4-24 indicates the economic importance of the manufacturing
sector in Maine, the Merrymeeting Bay region, and towns.
Significantly, Cumberland, Kennebec, and Androscoggin counties rank
among the top five tout of sixteen) in value of product manufactured;
while Sagadahoc and Lincoln counties rank tenth and sixteenth
respectively. Lewiston and Augusta to the north and west of the bay
rank second and seventh tout of 25) among towns in value of product
manufactured. Bath ranks tenth and Brunswick twenty-fifth, while all
other towns in the area produce less than the top 25 manufacturing
towns. What is of significance in these statistics is that they
demarcate quite vividly the inland corridor described by Barringer et
a1.(1972), an area of commercial activity directly related to the
interstate highway system. Lincoln and Sagadahoc counties to date
removed from easy access to this tranportation system have grown very
slowly in terms of commerce and industry as compared to Cumberland,
Androscoggin, and Kennebec counties linked by the Maine Turnpike (see
Table 4-26). Likewise, Lewiston and Augusta, directly adjacent to the
highway have grown into major commercial centers, while the
Merrymeeting Bay towns have languished in the backwaters. Bath and
Brunswick have managed to remain viable manufacturing centers due to
the activity of the Bath Iron Works. Completion of I-95 up the
western edge of the Bay will provide the access needed to spur
increased commercial and industrial activity (see also section 6.1,
Transportation). This implies that, with advanced planning, increased
commercial and industrial activity could be realized at little
environmental cost, and at great economic gain for the area.
MANUFACTURING--VALUE OF PRODUCT
in MAINE and in MERRYMEETING BAY REGION
1967--1973

			1967		rank(1)	1970		rank(1)	1973		rank(1)
MAINE			2,155,818,875		2,449,793,135		3,208,407,588
Sagadahoc Co.		78,999,576	10	65,017,933	12	109,588,721	11
Lincoln Co.		18,379,744	16	19,406,646	16	20,15,406	16
Cumberland Co.		391,648,096	1	444,084,946	1	598,922,470	1
*Kennebec Co.		243,448,738	3	268,131,383	3	324,812,459	3
*Anduoscoggin Co.	228,055,603	4	232,228,581	4	284,774,034	4
MERRYMEETING BAY
Bath			64,601,574	10	46,843,888	16	80,558,092	12
Bowdoin			n.d.			n.d.			n.d.
Bowdoinham		911,652			1,358,912		1,411,236
Brunswick		25,663,655	25	23,415,914		37,504,385	24
Dresden			n.d.			n.d.			n.d.
Richmond		3,640,349		5,328,764		12,251,972
Topsham			9,451,963		10,9T9,133		14,718,027
Woolwich		n.d.			n.d.			n.d.
*Augusta		70,114,554	7	79,476,066	7	95,742,151	8
*Lewiston		121,495,177	2	119,954,711	3	152,932,111	3
1. 16 Counties, Top 25 Towns.
* not in study area.

SOURCES: Maine Department of Labor and Industry 1967
Maine Department of Manpower Affairs 1973b.
INDUSTRIAL PLANT GROWTH
1967-1971
Merrymeeting Bay Region
		South		Mid
		Central(1)	Coastal(2)
New Plants
%		28.8		8.8
No. jobs	29.9		3.6
Plant Expansion
%		28.3		7.9
No. jobs	18.0		4.8
Total Growth
Plants		28.5		8.3
Jobs		24.1		4.2

1. Androscoggin and Kennebec counties primarily
2. Lincoln and Sagadahoc counties
SOURCE: Maine Dept. of Economic Development in
Barringer et. al, 1972,
One of the fastest growing economic sectors in Maine is contract
construction. Between 1960 to 1970 the number of jobs in this sector
grew by 23.6 percent, and between 1970 and 1973 it grew by an
additional 15.5 percent. This represents a 42.9 percent increase from
1960 to 1973 (see Tables 4-12 and 4-13).
In the Merrymeeting Bay area the number of persons holding contract
construction jobs increased from 530 in 1960 to 882 in 1970, a 66.4
percent increase (see Table 4-14). It is probable that many of these
jobs were held in companies outside the Bay towns as a recent
telephone survey of general contractors in the area revealed that in
these towns a maximum of 300 jobs were available through some 25
companies (many of which are owner-operated). The largest single firm
is Harry Crooker and Sons, Inc., in Brunswick which employs from 45
to 100 persons depending on the season. The second largest firm is
Reed & Reed in Woolwich which employs from 38 to 80 persons. All
other firms employ less than 10 persons throughout the years.
Section 6.4.2 of this report details the nature of the building
contractors in the area. There are no large scale operations. The
largest to date are builders that construct from 10 to 20 units per
year, and these are only three in number. Currently the depressed
economic conditions are slowing housing construction in the area.
Other construction businesses in the area are involved in road
building and maintenance, grading, backhoeing, etc.
As I-95 is completed and economic conditions improve, the
construction businesses in the area are expected to see substantial
activity. Because of the nature of the construction firms currently
in business in the area, the type of development most likely to occur
will be a proliferation of single family homes along major routes,
the result of little planning. Without planning and building controls
on the part of the towns, this incremental growth could lead to the
costly and inefficient use of land.
Service industries include medical and health. services,
educational services, hotels and rooming houses, auto repair
services, amusement and recreational, agricultural services, legal
services, other professional services, miscellaneous repair services,
non-profit membership organizations, etc. Between 1960 and 1970, the
jobs in the service sector statewide increased by 42.1 percent. In
Merrymeeting Bay between 1960 and 1970, this sector showed a 32.6
percent increase. Since 1970, the state has experienced an even more
rapid growth rate in service industries showing a net growth from
1960 to 1973 of 78.7 percent (see Tables 4-12, 4-13, and 4-14). How
this has been reflected in the Bay area is not known.
The Brunswick Naval Air Station has a significant impact on the
economic activity in the Merrymeeting Bay area and in the state as a
whole. In 1973, it was estimated that the Station generated 19.5
million dollars each year in military and civilian salaries, utility
service, materials expenditures, and special contracts (Kennebec
Journal 2/17/73). Besides employing some 2,900 military personnel at
a cost of $12.5 million per year, the Station also employs about 325
civil service personnel at an annual cost of $3.6 million.
In addition to the military and civilian payrolls, the Station spends
about $400,000 annually on contracts (road maintenance, housing,
etc.); $2.2 million for materials and some $800,000 for utilities and
other operating expenses. Most of these monies go to Maine firms.
An increase or reduction in the size of the Naval Air Station could
have significant results on the economy and on the environment.
Presently, it is suspected that a substantial housing demand is
created by Naval Air Station employees.
From 1968 to 1973, the number of jobs in Maine in the trade
industries increased by 37.3 percent. In the Merrymeeting Bay area,
from 1960 to 1970, a 20.4 percent increase was shown (from 1,773 to
2,136 jobs; see Tables 4-12, 4-.13, 4-14).
The number and type of wholesale and retail businesses in the area
are too numerous to detail. They include gas stations and automotive
parts stores, grocery stores, hardware stores, restaurants, drug
stores, antique shops, clothing shops, furniture and appliance
stores, department stores, and many specialty shops to name a few.
The town of Richmond contains 16 such establishments; Dresden, 12;
Bowdoinham and Bowdoin, a similarly small number; while Topsham,
Brunswick, Bath, and Woolwich together contain hundreds of such
businesses. Wholesale firms number far fewer than retail firms.
The economic importance of this sector is shown in Table 4-. In 1973
Sagadahoc County recorded about $21,000 in taxable sales; Lincoln
County, $38,000; and Cumberland County, $502,000.
Taxable Sales-Coastal Counties
(in thousands of $s)
	CUMBERLAND	LINCOLN		SAGADAHOC
1964	$219,581	$16,426		$11,290
1965	258,831		18,269		12,354
1966	291,706		19,363		12,220
1967	307,300		19,608		11,698
1968	335,303		22,318		12,515
1969	372,662		24,628		13,908
1970	379,755		27,360		15,485
1971	394r691		31,343		16,577
1972	445,155		33,842		18,696
1973	502,129		37,834		20,911
SOURCE: Department of Taxation, unpublished data.

The importance of tourism in retail and wholesale sales in the Merrymeeting Bay area
has been indicated in a study called the "Economic Importance of Recreation Along the Maine Coast" (Veazie 1971).
Table 4-28 presents the results of that study.
RETAIL SALES OF RECREATION-RELATED STORES
1958 and 1967
				1958	1967		INCREASE
				(millions of dollars) 	 (percent)
STATE OF MAINE 			266.5	352.5		32.2
Sagadahoc Co. 			5.9	7.2		22.0
Lincoln Co. 			6,0	7.8		30.0
Cumberland Co. 			48,3	59.0		22.2
Kennebec Co. 			11.1	15.4		38.7
SOURCE: Veazie 1971.
It is likely that the bulk of the activity within Sagadahoc, Lincoln,
and Cumberland counties occurs in the coastal areas, not within the
study area. However, as Kennebec County indicates, inland areas are
not without significance. The link provided by I-95 between the coast
and inland areas will undoubtedly result in increased
recreation-related traffic in the area, if not increased recreational
activity in the Bay area itself.
The portion of the recreational sales listed above which can be
attributed to summer tourism is not known. However, this could be
approximated from the following table which lists selected year-round
taxable sales and breaks out those generated during the summer
tourist season for Sagadahoc, Lincoln, Cumberland, and Kennebec
counties. Data are for the year 1969 showing percent increase since
1960.
TAXABLE SALES IN THE MERRYMEETING BAY REGION
1960-19691
			ANNUAL		% INCREASE	SUMMER(2)	% INCREASE
			($000)		1960-1969	($ 000)		1960-1969
STATE OF MAINE		1,185,140	65.0		562,059		64.7
Cumberland Co.		305,555		78.9
Sagadahoc Co.		14,073		31.5		152,4043	77.9
Kennebec Co.		68,147		85.0
Lincoln Co.		22,510		74.2

e = Partly estimated
1. Food, lodging, apparel, general merchandise, automobiles, furniture, building materials
2. May--September
3. Represents 37 percent of total annual sales of $410,285.
SOURCE: Veazie 1973.
Thus, it would appear that in 1969 tourism had little impact on
taxable sales in the Merrymeeting Bay region. In planning for the
future of Merrymeeting Bay, consideration should be given, however,
to a probable increase in the demand for retail stores from increased
traffic, both tourism-related and residential. If proper planning
precedes the development of these establishments, their effect can be
made positive with real social and economic benefits to the
communities. If, on the other hand, the pressures to increase these
businesses are left unguided, haphazard, ill-planned growth could
result.
In planning for the future of the Bay, the following findings
regarding economic activity are significant:
1. Presently the manufacturing sector supplies a predominance of the
jobs in the area.
2. Economic activities which are increasing include public
administration/government, construction, service, and trade. In
looking to attract business, these hold the greatest promise of
continued activity and should be preferred over manufacturing which
has been declining in importance state-wide since 1960.
3. Resource-based industries traditionally have been significant in
the Bay. Today, agriculture and forestry are the two most significant
natural resource-based commercial activities. Agriculture faces grave
economic conditions which are reducing its profitability and
concerted state and local action may be needed to ensure that prime
agricultural lands are not lost to development.
4. Forestry operations in Merrymeeting Bay have been geared to short
term economic gain and not long term productivity. Incentives for
proper forest management are needed to protect the future forest
stock and to ensure that undue erosion and sedimentation are not the
result.
5. Increased development will bring increased utilization of local
sand and gravel resources. Proper controls to require rehabilitation
of abandoned sites could alleviate the negative impacts of these
operations.
6. Towns will become increasingly bedroom community-oriented unless
effort is made to attract new business and industry. With the new
linkage to the main commerce corridor, I-95, towns could stand to
reap substantial benefits, if guided according to sound land
management principles (such as in areas suitable for development with
proper access and buffered from residential areas).
7. Tourism has not been a prime activity in the Merrymeeting Bay
area. However, increased traffic from I-95 will generate demands for
retail trade and services which ought to be guided to avoid conflict
with other incompatible uses.
8. Residential development pressures will increase contract
construction, which, if left unguided, could result in haphazard,
ill-planned growth. The present size and character of contract
construction businesses in the area make it unlikely that this sector
will assume the planning functions required for development to result
in efficient well-conceived growth. The towns must assume this
responsibility and institute strong controls as to the location,
density, and type of development allowed, based on sound planning
principles.
This section will examine the tax structures of the towns around
Merrymeeting Bay to define how taxation affects land use decisions
and the social structures of those towns, In the past, property taxes
have borne the major burden of municipal expenses. This has put undue
pressure on landowners to sell or subdivide, or has caused, in the
least, financial hardship. The following discussion will describe the
history of taxation procedures around the Bay and how recent
legislation has affected these.
Municipal taxes in the Merrymeeting Bay region have been
increasing at a rate of 7 percent per year since the late 1950s.
Total municipal expenditures in Sagadahoc County have increased from
$2,304,000 in 1957 to $3,971,000 in 1967 (Veazie 1973). At the same
time the growth of incomes in the area has not kept pace with the tax
demands they must bear. Total personal income has increased at a rate
of 4.8 percent per year, from $52.5 million to 1959 to $82.6 million
in 1971 (see Figure 1, and Table 4-30).
This rise in municipal taxes results from the rapidly escalating
costs of principally two services: education (the cost of which rose
68 percent between 1957 and 1967) and highways (which required an
additional 52 percent in budget in that same period). Meeting the
high costs of education required an average of 50 percent of the
local budget in Sagadahoc County in 1967. By 1973 this had risen to
nearly 60 percent with some of the smaller towns contributing upwards
of 70 percent to education (see Table 4-31). Road construction and
maintenance, another major expense, while growing substantially has
been met increasingly with state aid. Education costs, on the other
hand, until recently, have been almost totally the burden of
municipal governments. Proportionately, roads required about the same
share of municipal expenses in 1973 as in 1967, although total costs
have increased. This may be subject to change, however. The recent
budget
Tuends in Municipal Revenues and Expenditures in Sagadahoc County
1957--1967
(OOO's dollars)
					% Change
			1957	1967	1957-67
EXPENDITURES
Total			2304	3971	72.3
Education		1138	1911	67.9
Highways		400	607	51.7
Police & Fire		233	307	31.7
REVENUES :
Total			2391	4047	69.2
Local Sources		2015	3190	58.3
Property Tax		1614	2914	80.5

SOURCE: Veazie .	1973.
MUMICIPAL EXPENDITURES 1973
(000 dollars)
						Town		County
		Education		Roads		Govt.	%	Govt.		Protectionl	% I	Other	%	Total
Bath		2,409	54	185	4	337	8	60	1	422	9	1,031	24	4,444
Bowdoin		na	na	na	na	na	na	na	na	na	na	na	na	na
Bowdoinham	201	62	49	15	24	7	5	2	13	4	29	10	321
Brunswick	3,547	54	448	7	199	3	52	1	658	10	1,644 ;	25	6,548
Dresden		182	66	46	17	13	5	5	2	1	negl	28	10	274
Richmond	609	69	74	8	42	5	7	1	58	7	87	10	877
Topsham		934	60	152	13	50	4	22	2	139	12	105	9	1,192
Woolwich	352	69	58	10	11	2	7	1	16	3	126	15	571

1. Police, fire, ambulance, street lights

SOURCES: 1973 Town Reports submitted to the state Legislature did not include town road improvement funds or snow removal funds and towns may be called to bear an increasing share of road maintenance and construction costs.
Local governments have met the rising costs of municipal services
largely through the property tax. Between 1957 and 1967, the portion
of municipal costs borne by property taxes grew at a rate of 8
percent per year.
The picture is dramatized when one examines the actual property taxes
assessed since 1960 (Table 4-32). In Sagadahoc County, proper-ty
taxes assessed rose an average of 110.4 percent between 1960 and
1970. In the Bay area, this increase ranged from 40.3 percent in
Bowdoin to 179.4 percent in Dresden. The valuation of taxable
property for this period rose 93.3 percent in Sagadahoc County as a
whole, less than the increase in assessed taxation (see Table 4-33).
Only in the towns of Bowdoin, Bowdoinham, and Woolwich did the
increase in evaluation exceed the increase in taxation for this
period, as shown in Table 4-32. Elsewhere, taxes rose as much as five
times faster than assessed valuation.
Since 1970, there has been some relief in this respect. By 1973,
state and federal revenue sharing and increasing state and federal
grant programs had lowered the proportion of total revenues
attri-butable to property taxes to 56% for the Merrymeeting Bay area.
There is great disparity, however, within the Bay area as one can see
from Table 4-34. The portion of tax revenues raised by property taxes
in 1973 ranged from a low of 39 percent in Richmond to a high of 81
percent in Bowdoinham.
The recent passage of a significant tax reform law, Maine's new
educational funding law (L.D. 1994), effective 1974, is expected to
further relieve the property tax of a substantial portion of its
major burden, education, for many of the towns in the state,
including most of the
PROPERTY TAXES ASSESSED BY MUNICIPALITIES
1960--1974
(OOO's dollars)
							Change	8 Change
	1960	1964	1968	1970	1972	1974	1960-1970 :	1970-1974
Bath		1,138	1,302	1,898	2,318	2,583	2,679	103,6	15.5
Bawdoin		57	55	56	80	100	85	40.3	6.2
Bowdoinham	80	97	152	172	218	21S	115.0	23.8
Brunswick	1,223	1,471	1,946	2,807	3,240	3,194	129.5	13.7
Dresden		34	40	64	95	102	126	179.4	32.6
Richmond	130	161	196	258	309	324	98.4	25.5
Topsham		235	341	520	642	847	940	173.1	46.4
Woolwich	110	119	156	213	295	327	93.6	53,5
Sagadahoc Cty.	1,991	2,373	3,369	4,191	4,983	na	110.4	na

SOURCE: Veazie 1973i
STATE VALUATION 1960-19761
(000 dollar)
												%increase	%increase
		1960-1961 	1968-1969	1971-1972 	1973-1974	1975-1976 	1960-1972	1971-1976
Bath		51,200		56,860		61,200		68,500		86,800		20.0		40.5
Bowdoin		1,080		2,340		2,860		3,440		4,920		164.8		72.0
Bowdoinham	2,700		4,760		6,700		7,900		10,700		148.1		59.7
Brunswick	49,000		74,000		91,000		101,500		117,100		85.7		28.6
Dresden		1,520		2,720		2,800		3,160		4,800		84.2		71.4
Richmond	4,500		6,920		8,300		10,680		14,300		84.4		72.3
Topsham		12,900		21,320		28,200		34,060		42,600		118.6		51.1
Woolwich	3,800		6,200		9,000		11,280		16,350		136.8		81.7
Sagadahoc Cty.	43,360		46,350		59,730		83,840		n.a.		93.3		n.a.

1. 100 percent valuation

SOURCE: Maine Bureau cf Taxation, Maine State Valuation 1960, 1968, 1971, 1973, and unpublished data for 1975.
Merrymeeting Bay towns. In 1974, the impact of the law was only
partially felt, but in 1975, the towns will feel the full effect as
shown in Table 4-35. With the exception of Richmond, all towns will
see a substantial reduction in the local contribution to education,
and all towns will receive a sizeable increase in state aid.
The problems inherent in a tax structure which depends on property
taxes as a primary source of revenues should be alleviated by such
acts as L.D, 1994 and programs such as state and federal revenue
sharing. Yet it seems inevitable that costs of providing municipal
services such as roads, protection, water and sewerage will rise and
property taxes will continue to rise, although not as drastically as
in the past, to meet these.
The impact of rising property taxes is felt acutely by the elderly
who live on limited incomes and by families who have been typified as
"land rich and money poor." In the past, rising property taxes have
caused many of these families to sell off portions of their land or
in the least to bear substantial financial hardship. In 1971, the
state of Maine acted to relieve this problem by enacting the Elderly
Householders' Tax Relief Act. This act, effective in 1972, provides
for a direct grant to those elderly persons lover age 65 if male, 62
if female) maintaining homes, whether rented or owned, with a
household income of less than $4,000 annually. In 1972 the average
recipient was paid $104. This law should help alleviate the property
the tax burden for low income elderly citizens.
However, assistance of this Sort is not available to other types of
low income landowners, and this could well be a major problem in the
area. Rising property tax burdens could result in the break up of old
family estates, through the gradual selling of small parcels or
through sale of the entire property. Either could constitute a
regrettable loss to the Bay area.
Throughout the United States, the loss of farmland due to rising
pro-perty tax assessments has been identified as a serious problem.
An essential resource has been eroded by developmental pressures
which place the value of farmlands located in close proximity to
growth centers at a level equal to residential, commercial, or
industrial land. Taxes rise accordingly, farmers cannot meet the tax
costs, and the selling of small lots or outright sale of the entire
farm result.
Many states have taken steps to alleviate this problem by allowing
farmland to be taxed at its current use value rather than at its
potential value for development. In Maine a law such as this was
passed in 1971, called the Farm and Open Space Land Law. Effective in
1972, this law applies to "any tract or tracts of land including
woodland and wasteland constituting a farm unit of at least ten
contiguous acres on which farming activities produce a gross income
of at least $1,000 per year for three of the five calendar years
preceding the date of application for classifications." The state
issues guidelines to local assessors on the value of such lands. Once
lands are classified under the law, a change in use will result in a
penalty which would recapture past taxes for the period of
classification or ten years, whichever is less. In the Merrymeeting
Bay area, four farms have been classified under the law since it
became effective in 1972, including a 949-acre farm in Bowdoinham and
three farms in Brunswick totaling 352 acres. Two of the latter were
classified in 1974 whereas the others were classified in 1973.
Unfortunately, the economic problems of farmers, discussed in Section
4.4, are such that many farmers may be reluctant to give up the
option of selling off a portion of their land in order to avoid going
out of business, or in order to get out of an uneconomic situation
entirely. The fact that their land constitutes their only alternative
source of income, and that from year to year the economic conditions
nation-wide influence their ability to earn a living may be reducing
the effectiveness of the Farm and Open Space Land Law. It is also
true than many farmers do not know about the Farm and Open Space Law.
Ad-ministering a questionnaire to a sample of Maine farmers may point
out conclusions on why they have not utilized the law.
One of the problems which arise out of a property-based tax system
is that local citizens and officials are tempted to attract large
businesses and industries to their town in order to relieve the
general property tax burden. This could result in a situation where
non-monetary assets such as a clean environment or aesthetic features
are adversely affected.
While this has not been evidenced as a real problem to date in the
Merrymeeting Bay area, the potential might exist as I-95 is completed
and good transportation access becomes an attractive feature for
business. The state of Maine has recognized the problems inherent in
towns attracting businesses for tax benefits, and in 1973 enacted
what was called the Additional State Property Tax Law (Title 36, Sec.
455). This law, which became effective in 1974, attempts to phase the
local tax on business inventories out of local revenues and use it,
within a three-year period, to augment state revenues. The law allows
towns to continue receiving business inventory tax revenues from
businesses at that level which existed in 1973. That is, a town is
guaranteed, after three years, to receive state reimbursement for the
amount of revenue formerly obtained through the local business
inventory tax. Towns will not be able to tax new businesses for
inventory in the future, however. Despite this move to reduce the
temptation to accept businesses solely for tax reductions, towns may
still envision substantial tax benefits from business in terms of
increased valuation in land and buildings, and hence a lowering of
overall tax rate. Table 4-36 compares tax rates by town in 1972 and
1974. While towns may benefit from business developments in some
instances, care should be taken in evaluating the tax burdens imposed
by these developments as well as the social and environmental
consequences.
MUNICIPAL TAX RATES 1972-1974
Merrymeeting Bay Area
				Rate of		Full Value*			Rate of		Full Value*
		Assessment	Taxation	Tax Rate	Assessment	Taxation	Tax Rate
		Ratio (%)	(Mills)		(Mills)		Ratio (%)	(Mills)		(Mills)
Bath		80		45.00		37.70		60		42.00		25.57
Bowdoin		7		31.40		29.08		6		227.00		40.58
Bowdoinham	100		31.00		27.59		100		28.00		37.08
Brunswick	70		40.30		31.92		55		40.30		31.77
Dresden		45		64.00		32.28		50		53.00		25.10
Richmond	50		36.00		28.96		821		34.00		32.98
Topsham		71		37,00		24.87		50		38.50		36.23
Woolwich	3		102,00		26.17		20		103.00		34.50

*State Valuation (100%) divided by total tax revenue of municipality.

1. 1973 ratio

SOURCES: Maine Bureau of Taxation, unpublished data for 1974.
Maine Bureau of Taxation, 1972 data in .Veazie
1973.
Reed & D'Andrea staff calculations for 1974 full value tax rate.
Just as farms may be subject to growth pressures and higher taxes,
forested lands may also. To alleviate this pressure on one of Maine's
most valuable resources, the state enacted the Tree Growth Tax Law in
1971. In its amended version, the law requires woodlots greater than
500 acres to be classified by assessors as forest land and allows
woodlots less than 500 acres and greater than 10 acres to be so
classed at the owner's request. Lands classed as forested are to be
taxed according to their value as woodlots rather than fair market
value, if the owner agrees to keep the land in its current
use--forest management. Failure to do so would result in a penalty
equal to the tax advantage gained while classed as forest land. In
the Merrymeeting Bay area, two parcels were classed as tree growth in
1974 (town of Brunswick), totaling 67 acres. These normally were
taxed (1972) at $786, but with the Tree Growth Tax Law, they are now
taxed at $40 (combined). The effectiveness of the law in keeping
forested land in production in Merrymeeting Bay is presently
ques-tionable as there is a noticeable lack of response to it. As
with the Farm and Open Space Law, many farmers do not know about the
Tree Growth Tax Law. The issuance of a questionnaire to a sample of
Maine farmers could more effectively conclude why more do not utilize
it. Apparently the profits gained by cutting and selling off lots for
development are greater than the potential tax savings. Another
factor affecting its effectiveness is the profitability of forest
management which fluctuates. In the future the law may well be a
determining factor in keeping forest lands in resource management if
taxes continue to rise.
Tax structures represent significant forces affecting land use
decisions and alternatives in an area, Recognition of this elementary
fact is essential if local and state governments desire to affect
proper land use. The following summarizes the major points of the
preceding discussion with reference to their planning implications:
1. Education has been a major burden for local taxes, particularly
property taxes, until the recent enactment of L.D.1994. This will
alleviate the education burden in all towns in the Merrymeeting Bay
area, While in some parts of Maine the effect of this law has been to
reduce the willingness or ability of towns to allocate monies for
conservation activi-ties such as public acquisition, increased
planning, and better enforcement procedures; this is not the case in
Merrymeeting Bay. Here the tax burden has been relieved and attitudes
are open for a reallocation of tax monies.
2. Another major tax burden has been the construction and maintenance
of roads. Until the present year (1975) the state has contributed
heavily towards town road improvement and snow removal. It is
difficult to assess whether the cutback will be temporary or long
standing. In either case, towns may wish to consider including a
requirement for developers to contribute to road service, as a means
of alleviating this burden.
3. Property tax pressures are most acutely felt by the poor and
elderly landowners, The state has provided some relief to elderly
householders with annual incomes less than $4,000. This is not enough
to avert the continued break up of large family parcels due to
economic duress. Some parts of the Bay will be best protected by the
continuation of large ownerships. This could help alleviate adverse
impacts in areas not suited to development or could simply help to
maintain the rural, undeveloped character of the Bay. Instituting a
mechanism whereby landowners could sell development rights to the
state or local governments would greatly alleviate this problem.
4. Similarly, farms are subject to development pressures. The Farm
and Open Space Land Law is not enough to avoid the continued break up
of farms. More drastic subsidies are needed and more liberal
financing.
5. Tax pressures are a reason for many towns to attract new business.
New business brings, generally, tax relief. In order to avoid a
situation where a town incurs expenses for a business incentive which
it cannot later recoup, a set of guidelines should be drawn up
detailing how all costs as well as benefits are to be surmised prior
to commitment to a business.
American Forestry Institute. 1972. Present forest land utilization
for the New England Region and projections for the future. AFI, New
England Natural Resources Center, Boston. Barringer, Richard, et al.
1972. A Maine manifest. Tower Publishing Co., Portland.
Bones, James T. and D. R, Dickson. 197. Pulpwood production in the
northeast--1970. U.S.D.A. Forest Service Resource Bulletin NE-24.
Northeast Forest Experimental Station, Upper Darby, Pa. 35 p.
Dearborn, Vance E. 1974. Population estimates for 194. IN Resource
Development Highlights, Vol. IX, No. 5, Cooperative Extension
Service, Univ. of Maine, Orono.
Dearborn, Vance E. and Ronald J. Daigle. 1972. Maine population
changes from 1960 to 1970. Cooperative Extension Service, Dept. of
Agriculture and Resource Econ., Univ. of Maine, Orono. 17 p.
Dresden Planning Board. 1971. Preliminary report of the planning
board. Dresden, Maine 30 p.
Ferguson, Roland H., and N. P. Kingsley. 1972. The timber resources
of Maine. U.S. Forest Service Resource Bulletin NE-26, Northeast
Forest Experimental Station, Upper Darby, Pa. 129 p.
Ferguson, Roland H. and F. R. Longwood. 1960. The timber resources of
Maine. Northeast Forest Experimental Station, U.S.D.A., Upper Darby,
Pa. 75 p.
Harris, Curtis C. Jr. 1974. Projections of demographic and economic
activity by county by decade to the year 2000. Computer printout.
Univ, of Maryland, Baltimore.
Kennebec Journal. February 17, 1973. Bath Iron Works enjoying record
backlog of orders.
Kennebec Journal, February 17, 1973. Brunswick base means
$19,500,000.
Lord, Willis. April 1975. Personal interview, Department of
Agriculture, Augusta.
Maine Bureau of Forestry. L973. Maine primary forest products
manufacturers as of December 31, 1973. Bureau of Forestry,
Augusta.
Maine Bureau of Taxation. 1960. Maine State Valuation 1960. Bureau of
Taxation, Augusta.
Maine Bureau of Taxation. 1960. Maine State Valuation 1960. Bureau of
Taxation, Augusta.
Maine Bureau of Taxation. 1968. Maine State Valuation 1968. Bureau of
Taxation, Augusta.
Maine Bureau of Taxation. 1971. Maine State Valuation 1971. Maine
Bureau of Taxation, Augusta. 197 p.
Maine Bureau of Taxation. 1973. Maine State Valuation 1973-basis on
which state and county taxes are assessed during 1973 and 1974.
Maine Bureau of Taxation, Augusta. 206 p.
Maine Bureau of Taxation. 1975. Unpublished data on farm and open
space and tree growth tax lands. Bureau of Taxation, Augusta.
Maine Department of Agriculture. 1975. Unpublished data on farming in
Lincoln, Sagadahoc, and Cumberland counties for 1969 and estimates
for 1974. Dept. of Agriculture, Augusta.
Maine Department of Commerce and Industry. 1973. Maine economic data
book. Maine Dept. of Commerce and Industry, Augusta,
Maine Department of Commerce and Industry. 1973. Community investment
buildings, an approach to Maine's industrial development. Maine Dept.
of Commerce and Industry, Augusta. 45 p.
Maine Department of Commerce and Industry. 1974. Facts about
industrial Maine. Dept. of Commerce and Industry, Augusta. Maine
Department of Education and Cultural Services. 1975. Unpublished
files on local share to education. Department of Education &
Cultural Services, Augusta.
Maine Department of Labor and Industry. 1967. Census of Maine
manufactures. Dept. of Labor & Industry Bulletin 428. Augusta. 22
p.
Maine Department of Labor and Industry. 1970. Census of Maine
Manufactures. Dept. of Labor & Industry Bulletin 480. Augusta. 22
p.
Maine Department of Manpower Affairs. 1973a. 1974 Maine buyers'
guide.
Maine Dept. of Commerce & Industry, Augusta. 180 p.
Maine Department of Manpower Affairs. 1973b. Census of Maine
Manufactures. Dept. of Labor and Industry Bulletin 519. Augusta. 22
p.
Maine Department of Manpower affairs. 1975. Unpublished files on
employment and labor force. Dept. Manpower Affairs, Augusta.
Maine Guarantee Authority. n.d. Requirements for obtaining community
industrial building loans from Maine Guarantee Authority (MGA).
Augusta. mimeo.
Maine State Planning Office. 1973. Maine population projections.
State Planning Office, Augusta. 32 p.
Maine Sunday Telegram. March 30, 1975. Unemployed reject jobs, says
BIW.
N.A. 1973 Town reports for Bath, Bowdoin, Bowdoinham, Brunswick,
Dresden, Richmond, Topsham, and Woolwich.
Ploch, Louis A. 1974. Maine, a growth area. IN Resource Development
Highlights, Vol. IX, No. 5, Cooperative Extension Service, Univ. of
Maine, Orono.
TRIGOM. 1974. A socio-economic and environmental inventory of the
North Atlantic Region. FOR the U. S. Bureau of Land Management.
TRIGOM, Portland, Maine. 8 vol.
U. S. Bureau of Census. 1971. Statistical abstract of the U. S.
Tables 42 and 10. U, S. Bureau of Census, Washington, D. C.
U. S. Bureau of Census. 1972. Statistical abstract of the U. S.
Tables 42 and 10. U. S. Bureau of Census, Washington, D. C.
U. S. Census of Agriculture. 1969. Farm Indicators 1964-1969
U. S. Soil Conservation Service. 1974. Time and tide resource
conservation and development program of action, U. S. Dept. of
Agriculture, SCS, Orono, Maine 068 p.
Veazie, Carl E. 1971. A report to the State Planning Office, the
economic importance of recreation along the Maine coast. Public
Affairs Research Center, Bowdoin College, Brunswick.
Veazie, Carl E. 1972. Estimates of peak seasonal population in each
municipality in Maine 1970. FOR Maine State Planning Office,
Augusta.
Veazie, Carl E. 1973. A report to the Southern Mid Coast Regional
Planning Commission, socio-economic analysis of the southern mid
coast region. Public Affairs Research Center of Bowdoin College,
Brunswick.
Chapter 5
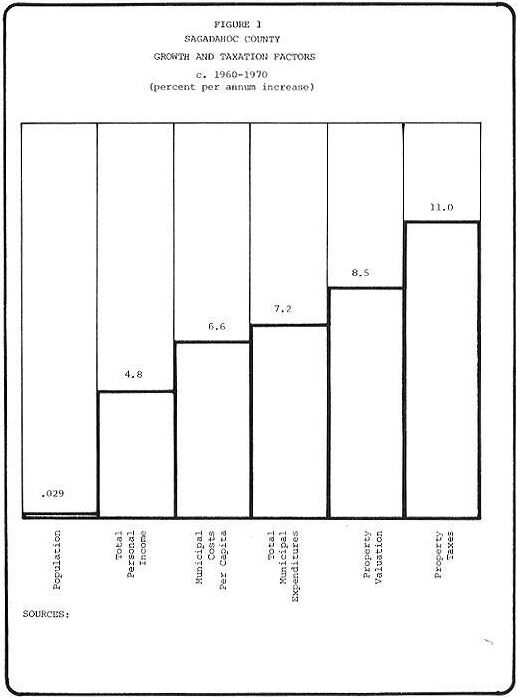